We set up a 2-meter steel frame with tensioned wires and a rainfall simulator on site in Derby. The test plot is staked with erosion pins at 0.5 m intervals to measure surface loss after each storm event. Sediment traps collect runoff samples. We combine this field data with the RUSLE equation in our lab to predict long-term soil loss rates. Before the erosion analysis, we often run a granulometry to classify the soil texture and a permeability test to understand infiltration capacity. The whole setup takes one day for a typical 20 m² slope.
On Derby's alluvial floodplain, erosion is driven by bank undercutting during winter floods; sandy deposits lose particles to surface runoff.
Process overview
Local context
Derby sits on a mix of glacial till, alluvium and Mercia Mudstone. The mudstone weathers into a highly erodible clay when exposed. Heavy winter rainfall saturates the soil quickly. Without a proper erosion analysis, a construction site can lose topsoil at rates exceeding 10 t/ha/yr. These losses clog local drainage channels and increase sediment load in the Derwent. Our study identifies the exact risk zones and recommends sediment basins or mulching before work starts.
Reference standards
BS 5930:2015 (Code of practice for ground investigations), Eurocode 7 (EN 1997-1:2004) – Geotechnical design, BS 1377 (Standard test method for erosion of soil by water), RUSLE2 methodology (USDA-ARS)
Additional services
Field erosion pin monitoring
We install a grid of steel pins across the slope and record surface lowering after each rainfall event. Readings are taken monthly for at least six months.
RUSLE modelling and soil loss maps
Using rainfall data from Derby Weather Centre and your site's slope length, we calculate the annual soil loss. The output is a colour-coded map with critical zones.
Runoff and sediment sampling
We place sediment traps and flumes at the slope toe. Samples are analysed for particle size distribution and total suspended solids.
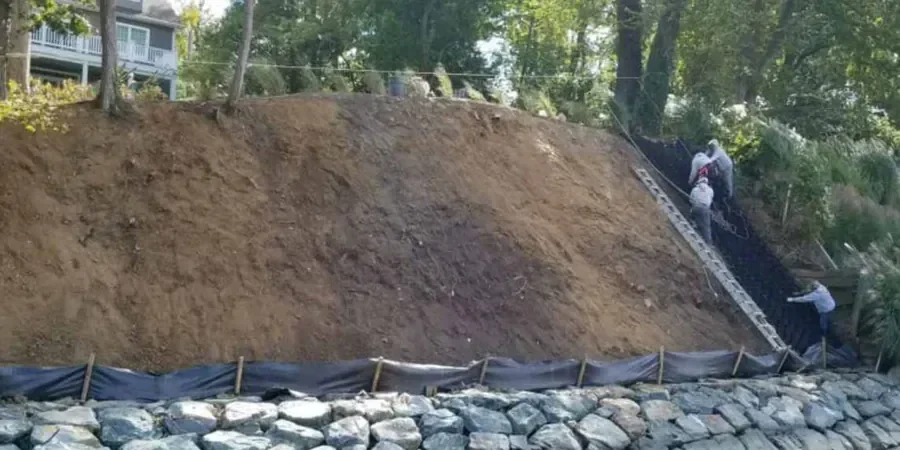
Erosion control design recommendations
Based on the soil loss rate, we propose silt fences, hydroseeding, geotextiles or temporary drainage channels. All designs comply with BS 6031.
This service complements our laboratory testing work for a complete project analysis.
Typical parameters
Common questions
How long does a soil erosion analysis take in Derby?
Field installation takes one day. Monitoring runs for a minimum of six months to capture seasonal variation. The final report is delivered two weeks after the last field reading.
What is the difference between RUSLE and the pin method?
The pin method measures actual surface lowering on site. RUSLE is a predictive model that estimates long-term soil loss using rainfall erosivity, soil erodibility, slope length, cover and management factors. We use both to cross-validate results.
How much does a soil erosion analysis cost in Derby?
A standard analysis covering a 0.5 ha site with six months of monitoring and a full report costs between £750 and £1.990. The final price depends on site access, number of monitoring visits and laboratory tests required.